Difference: SplitClusterStudy (8 vs. 9)
Revision 92017-12-15 - AdamHunyadi
| Line: 1 to 1 | ||||||||
|---|---|---|---|---|---|---|---|---|
Split Cluster StudyLinks | ||||||||
| Line: 58 to 58 | ||||||||
| For no PU, I usually generate TTbar events. | ||||||||
| Deleted: | ||||||||
| < < | Running the HistogramMergerRunning the HistogramMerger is as simple as checking out the git repository and specifying the target files and the output name in src/main.cxx. | |||||||
How to add dynamic inefficiencyThe tag is set when the db file is generated. | ||||||||
| Line: 82 to 78 | ||||||||
| process.dynineffprefer = cms.ESPrefer("PoolDBESSource", "DynIneffReader") | ||||||||
| Added: | ||||||||
| > > | Calculating the pileup for data filesExample:brilcalc lumi --byls -u /nb --minBiasXsec 78100 --begin 5659 --end 9999 | head -n-8 | tail -n+5 | sed "s;|;;g;s;:; ;g"):This bash-script can be called from the SplitClusterStudy analyzer (currently commented out), but opening a socket to store the string as a result still regularly fails (and also takes up too much time when testing). Running the HistogramMergerRunning the HistogramMerger is as simple as checking out the git repository and specifying the target files and the output name in src/main.cxx. | |||||||
ResultsTTbar events, no pileup, 95% dcol efficiency statistics files: | ||||||||
| Line: 98 to 107 | ||||||||
ValidationExamples for module cluster plots of single events are shown below. Nothing unordinary to be seen. | ||||||||
| Added: | ||||||||
| > > |
| |||||||
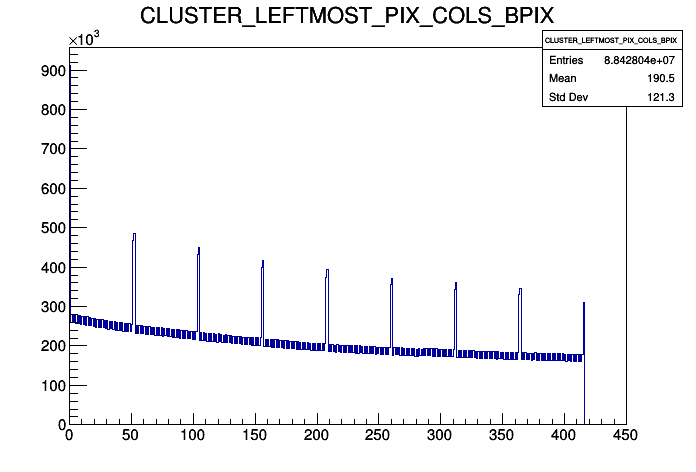
Fluctuations in the leftmost and the rightmost pixelsPositions for the boundary clusters in pixels:
| ||||||||
| Changed: | ||||||||
| < < |
| |||||||
| > > |
| |||||||
Plans for the analysis | ||||||||
| Line: 117 to 130 | ||||||||
| ||||||||
| Added: | ||||||||
| > > |
| |||||||


View topic | History: r11 < r10 < r9 < r8 | More topic actions...
Ideas, requests, problems regarding TWiki? Send feedback