Difference: SplitClusterStudy (7 vs. 8)

Revision 82017-12-15 - AdamHunyadi

Line: 1 to 1
 
META TOPICPARENT name="AdamHunyadi"

Split Cluster Study

Links

Line: 10 to 10
 
  • The pileup mixing seems to throw away all the digis that are coming from the mixed pileup. This makes it difficult to add the digi markers.
  • The digi collection does not exactly contain the same pixels as the cluster collection. Mostly the digis is a bigger set (with all the cluster pixels available in it), but for now on I create a lookup table and add zero markers for any extra cluster digis that might turn up. The rate of "mocked digis" is a good number to pay attention to when running the simulations even on the grid.
Changed:
<
<

TODOs

>
>

TODOs (problem fixes, find plans at the end of this page)

 
  • Add modifications to the pileup mixing modules so that it propagates the digi flag collection from the mixed data and it can be combined to a correct flag collection
  • Modify the histogram merger code not to merge the "ModuleClusterPlots" even if they are from the same run/lumiblock/event
Line: 92 to 90
 /store/user/ahunyadi/SCS/Run2_CMSSW93X/SCS_93X_mcRun2_DynIneff_95_GEN_SIM_RAWTODIGI_evt100000
Added:
>
>
For users on the ui3 of the Wigner institute:
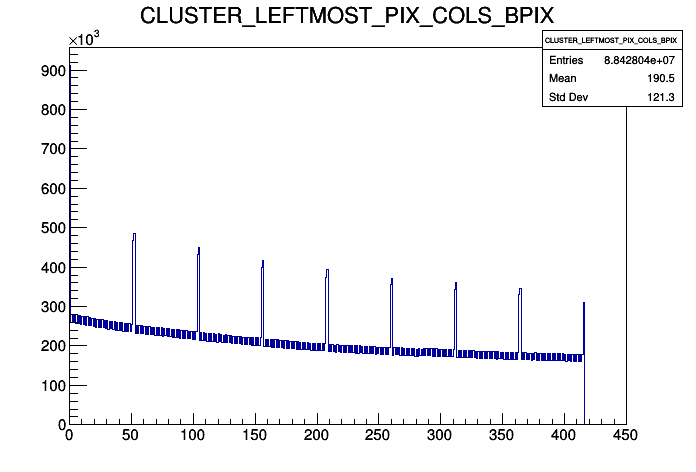
/data/gridout/ahunyadi/SCS/Run2_CMSSW93X/SCS_93X_mcRun2_DynIneff_95_GEN_SIM_RAWTODIGI_evt100000/171212_101805/0000/

Validation

Examples for module cluster plots of single events are shown below. Nothing unordinary to be seen.

Fluctuations in the leftmost and the rightmost pixels

Positions for the boundary clusters in pixels:

All boundary pixels Leftmost pixels Rightmost pixels
Since the dcol loss has the opposite effect on the rightmost and leftmost pixels, the total boundary pixel distribution does not show any fluctuation effect. For 95% dcol efficiency the leftmost cell shows ~8.5-10.5% less pixels in the odd columns For 95% dcol efficiency the rightmost cell shows ~8.5-10.5% less pixels in the even columns
 

Plans for the analysis

Added:
>
>
  • Write a tool to properly calculate the percentage differences in the even and odd cols (excluding the fidicual areas)
  • Measure the correspondence of the fluctuation in the leftmost and rightmost pixel position to the dcol efficiency correspondence by creating an efficiency scan with the SplitClusterStudy plugin
  • Measure distributions for the left- and rightmost pixels in the data and give estimation for dcol efficiency loss.
 -- AdamHunyadi - 2017-12-04 \ No newline at end of file
Added:
>
>
META FILEATTACHMENT attachment="CLUSTER_BOUNDARY_PIX_COLS_BPIX.png" attr="" comment="Boundary cols. BPIX example" date="1513345428" name="CLUSTER_BOUNDARY_PIX_COLS_BPIX.png" path="CLUSTER_BOUNDARY_PIX_COLS_BPIX.png" size="12828" stream="CLUSTER_BOUNDARY_PIX_COLS_BPIX.png" tmpFilename="/usr/tmp/CGItemp131" user="AdamHunyadi" version="1"
META FILEATTACHMENT attachment="CLUSTER_LEFTMOST_PIX_COLS_BPIX.png" attr="" comment="Leftmost pixels, BPIX example" date="1513345784" name="CLUSTER_LEFTMOST_PIX_COLS_BPIX.png" path="CLUSTER_LEFTMOST_PIX_COLS_BPIX.png" size="13001" stream="CLUSTER_LEFTMOST_PIX_COLS_BPIX.png" tmpFilename="/usr/tmp/CGItemp5080" user="AdamHunyadi" version="1"
META FILEATTACHMENT attachment="CLUSTER_RIGHTMOST_PIX_COLS_BPIX.png" attr="" comment="Rightmost pixels, BPIX example" date="1513345822" name="CLUSTER_RIGHTMOST_PIX_COLS_BPIX.png" path="CLUSTER_RIGHTMOST_PIX_COLS_BPIX.png" size="12588" stream="CLUSTER_RIGHTMOST_PIX_COLS_BPIX.png" tmpFilename="/usr/tmp/CGItemp4992" user="AdamHunyadi" version="1"
 
This site is powered by the TWiki collaboration platform Powered by Perl This site is powered by the TWiki collaboration platformCopyright &© by the contributing authors. All material on this collaboration platform is the property of the contributing authors.
Ideas, requests, problems regarding TWiki? Send feedback